Hazard and risk mapping
One of the best ways of presenting the results of hazard and risk analysis is through maps. Maps provide people with a familiar spatial dimension, and the characteristics of a given hazard can be overlaid on other types of information, such as features of the environment, and relevant characteristics of a community.
There is some confusion about the terminology associated with hazard maps, with different disciplines and countries using different names for the various types of map. Below are some of the more common types of map with an indication of the information that may be shown on them.
Table 5.12: Mapping types
Map type |
Information shown |
Hazard map |
Shows relevant hazard characteristics including area extent and intensity distribution. |
Risk map |
Same as for hazard map, but also shows probability of occurrence of a hazardous event. |
Vulnerability map |
Shows distribution of the elements of the community that may be harmed or damaged. |
Very few authors or researchers have combined the risk and vulnerability maps to show graphically the level of harm that may occur from a hazard of a given intensity and extent.
We will discuss vulnerability mapping in Topic 6, but for the moment let us consider hazard maps.
An example of why hazard maps are useful
At the beginning of this topic we considered the description of floods, and the parameters that might be useful for a flood map. Figure 5.3 provides an example of a flood map, which shows:
- the normal river banks (heavy purple lines);
- contours relative to the normal river height (light purple lines with height figures '5', '10' and '15');
- 1/20 year flood (heavy shading);
- 1/50 year flood (moderate shading);
- 1/100 year flood (light shading);
- maximum flood on record (heavy red line);
- river heights for each flood frequency at various sections (as tables);
- streets, street names and allotments;
- some buildings.
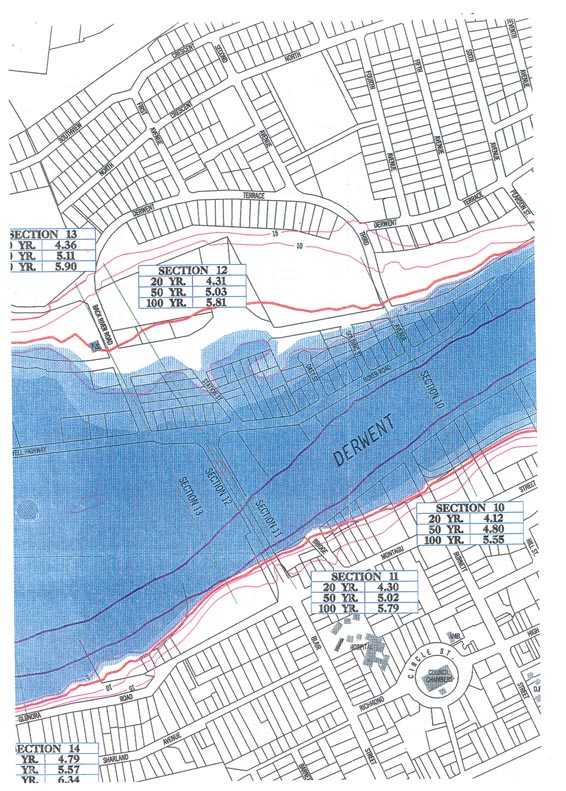
Figure 5.3
New Norfolk Flood Map
Source: Water Resources Department, HEC (1992). Flood inundation. New Norfolk Flood Plain Study, Report No 8/92, Geographic Information, Hobart. Scale for map 1:5000.
A map such as this indicates immediately the area that is likely to be inundated by flooding, the streets that are likely to be cut off, and provides information which will form the basis of further hazard analysis and emergency management planning.

Thus the value of hazard maps is not only to show which areas are likely to be affected by hazards, but also to prompt the identification of other problems and hazards that may arise.